This website is managed by Ultima Markets’ international entities, and it’s important to emphasise that they are not subject to regulation by the FCA in the UK. Therefore, you must understand that you will not have the FCA’s protection when investing through this website – for example:
You will not be guaranteed Negative Balance Protection
You will not be protected by FCA’s leverage restrictions
You will not have the right to settle disputes via the Financial Ombudsman Service (FOS)
You will not be protected by Financial Services Compensation Scheme (FSCS)
Any monies deposited will not be afforded the protection required under the FCA Client Assets Sourcebook. The level of protection for your funds will be determined by the regulations of the relevant local regulator.
Note: UK clients are kindly invited to visit https://www.ultima-markets.co.uk/. Ultima Markets UK expects to begin onboarding UK clients in accordance with FCA regulatory requirements in 2026.
If you would like to proceed and visit this website, you acknowledge and confirm the following:
1.The website is owned by Ultima Markets’ international entities and not by Ultima Markets UK Ltd, which is regulated by the FCA.
2.Ultima Markets Limited, or any of the Ultima Markets international entities, are neither based in the UK nor licensed by the FCA.
3.You are accessing the website at your own initiative and have not been solicited by Ultima Markets Limited in any way.
4.Investing through this website does not grant you the protections provided by the FCA.
5.Should you choose to invest through this website or with any of the international Ultima Markets entities, you will be subject to the rules and regulations of the relevant international regulatory authorities, not the FCA.
Ultima Markets wants to make it clear that we are duly licensed and authorised to offer the services and financial derivative products listed on our website. Individuals accessing this website and registering a trading account do so entirely of their own volition and without prior solicitation.
By confirming your decision to proceed with entering the website, you hereby affirm that this decision was solely initiated by you, and no solicitation has been made by any Ultima Markets entity.
Learn to spot and trade the reverse cup and handle pattern. It is a key bearish signal, with clear steps, confirmation, and some practical strategies.
The reverse cup and handle pattern is a technical analysis formation used by traders to anticipate potential bearish reversals in price charts. Unlike the classic bullish cup and handle pattern, the reverse version signals that an uptrend may be losing strength, potentially leading to a downward move.
Understanding this pattern is useful across markets, including stocks, forex and cryptocurrencies. In this article, we will explore how the pattern forms, how to identify it, practical trading strategies, and common pitfalls to avoid.
What Is the Reverse Cup and Handle Pattern?
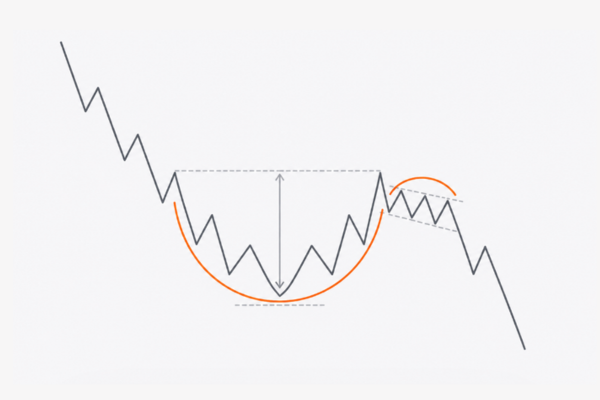
The reverse cup and handle pattern is the mirror image of the traditional cup and handle. While the standard version has a rounded base followed by a breakout to new highs, the reverse pattern has a rounded top followed by a small consolidation.
This indicates that buying momentum is weakening and sellers may soon dominate.
Pattern Components
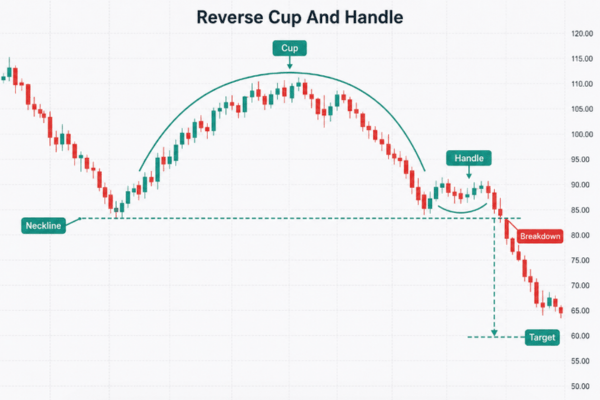
Cup: A smooth, rounded top signalling diminishing bullish momentum. Handle: A minor sideways or slightly upward consolidation, showing a pause before potential breakdown. Breakdown Point: A decisive move below the handle’s support confirms a bearish reversal.
This pattern often appears after a prolonged uptrend, helping traders anticipate shifts in market sentiment.
How the Pattern Develops
Psychology Behind the Pattern
Uptrend Phase: The price moves upward, driven by bullish sentiment.
Rounded Top Formation: Buyers lose momentum near the peak, causing price to form a curved top.
Handle Formation: Price enters a brief consolidation, as sellers test the support without strong buying pressure.
Breakdown: A close below the handle’s support indicates sellers are taking control, often triggering further declines.
How to Identify the Pattern in Charts
Traders use the following criteria to identify the reverse cup and handle pattern:
Prior Uptrend: Ensure the price has been rising beforehand.
Handle Consolidation: Minor sideways movement or slight upward drift.
Breakdown Confirmation: Daily close below handle support with rising volume.
Volume Observation: Volume usually declines during the cup formation and rises during breakdown.
Tip: Combining these elements with indicators like RSI divergence or moving average crossovers increases reliability.
Practical Trading Strategy
Step‑by‑Step Approach
1. Entry Point
Open a short or sell position once price closes below the handle’s support.
2. Stop Loss
Place just above the handle or the cup’s peak to manage risk.
3. Profit Target
Measure the height from the rounded top to the handle support and project that distance downward from the breakdown.
4. Additional Confirmation
Use volume, RSI, or moving averages to strengthen signal confidence.
Common Mistakes and Best Practices
Mistakes to Avoid
Mistake
Explanation
Premature Entry
Entering before handle support is broken can lead to false signals.
Ignoring Volume
Low volume breakouts are less reliable.
Misidentifying Shape
Sharp or V-shaped tops do not qualify as a proper cup.
Ignoring Trend
A strong bullish market may invalidate the pattern temporarily.
Best Practices
Focus on higher timeframes like daily or weekly charts.
Use liquid assets such as major forex pairs, large-cap stocks, or leading cryptocurrencies.
Combine with technical indicators to improve pattern reliability.
Conclusion
The reverse cup and handle pattern is a valuable tool for spotting bearish reversals. Recognising its rounded top, handle consolidation, and breakdown point allows traders to plan entries, stops, and profit targets.
While no pattern guarantees outcomes, combining this formation with volume analysis and other technical indicators improves trade decision-making.
FAQs
What is the reverse cup and handle pattern?
A bearish chart pattern with a rounded top and handle consolidation, signalling potential downward movement.
Is it reliable?
It can be useful when confirmed with volume and other indicators, but it is not guaranteed.
Where can it appear?
It can occur in stocks, forex, commodities, and cryptocurrencies.
Share Now
Disclaimer:This content is provided for informational purposes only and does not constitute, and should not be construed as, financial, investment, or other professional advice. No statement or opinion contained herein should be considered a recommendation by Ultima Markets or the author regarding any specific investment product, strategy, or transaction. Readers are advised not to rely solely on this material when making investment decisions and should seek independent advice where appropriate.
Thank you for visiting the Ultima Markets website. Please note that this website is intended for individuals residing in jurisdictions where access is permitted by law. Ultima and its affiliated entities do not operate in your home jurisdiction.
By clicking ‘Acknowledge’, you confirm that you are entering this website solely on your own initiative and not as a result of any specific marketing outreach. You wish to obtain information from this website based on reverse solicitation principles, in accordance with the applicable laws of your home jurisdiction.